Module 5: Plot.ly
Module 5: Plot.ly
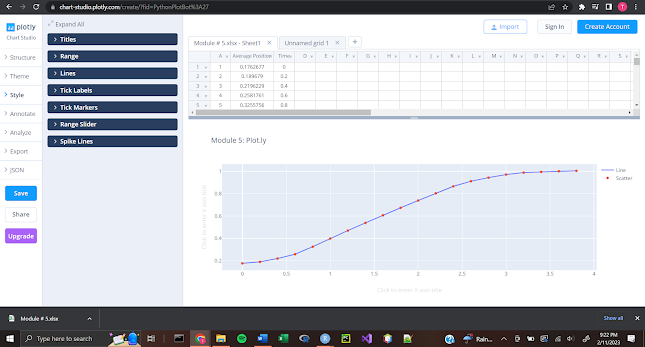
This weeks assignment consisted of toying about with a software called Plot.ly. I like to think this is a slightly more user friendly and comparable interface to Tableau at which with the provided dataset I was able to visualize a scatter and line graph that correspond to one another by using two trace layers in my assignment.
The outcome is based on how expansive the data is but, this data was only two columns, which calls for a simpler visualization.


Comments
Post a Comment