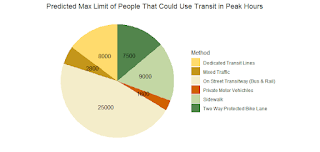
Module 4: Tableau
My results were a bit rudimentary and odd.
More than my results, what kind of data slicing was necessary for this homework assignment, and furthermore, do you have any good advice on how to be more creative with tableau, this is my first time ever hearing about or using this software, so I am a bit lost but I am still eager to learn.
I sliced the variables down to the most sensible based on their amounts, the hard part is accurately visualizing them because there are some values that are lower end outliers, where they are far less than the others by an magnitude base order of ten, some numbers are millions, and some are in the billions on this visual.
What I am curious to know, is how that us students can locate and find more in app elements to assist with our creation of these visuals.


Comments
Post a Comment