The Tampa Feasibility Report featuring R based Visualizations

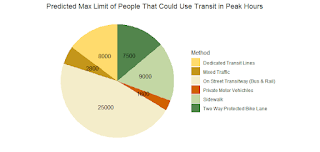
Visualizations for Professional Writing's Final Deliverable These visualizations were taken from FDOT data for our local district on the subject of transit usage, and crash data that was munged into relative ratios that had a regression performed on these variables within. Pie Chart The above figure is a pie chart using data collected that estimates the higher end limits of hourly numbers of passengers that could utilize each method of public transportation during peak hours Transit Regression This figure here shows the monthly totals for crashes, fatalities and serious injuries from accidents recorded within FDOT data and the regression line method was used against the 'free_y' inputs which allowed there to be a 95 percent confidence regression on the other two variables from the one in question showing certain trends within and between variables. Bus versus Pubic Transport with 95 percent regression line fitted The same style of regression was sued here but this time i...